Troubleshooting
This document includes some troubleshooting cases in practice.
PaiServicePodNotReady Alert
This is a kind of alert from the alert manager and is usually caused by the container being killed by the operator or OOM killer. To check if it was killed by OOM killer, you can check the node's free memory via Prometheus:
- visit Prometheus web page, it is usually
http://<your-pai-master-ip>:9091. - Enter query
node_memory_MemFree_bytes. - If free memory drops to near 0, the container should be killed by OOM killer
- You can double-check this by logging into the node and run the command
dmesgand looking for phaseoom. Or you can rundocker inspect <stopped_docker_id>to get more detailed information.
Solutions:
- Force remove unhealthy containers with this command in terminal:
kubectl delete pod pod-name --grace-period=0 --force - Recreate pod in Kubernetes, this operation may block indefinitely because dockerd may not function correctly after OOM. If recreate blocked too long, you can log into the node and restart dockerd via
/etc/init.d/docker restart. - If restarting doesn't solve it, you can increase the pod's memory limit.
NodeNotReady Alert
This is a kind of alert from alert manager, and is reported by watchdog service. Watchdog gets such metrics from Kubernetes API. Example metrics is like:
pai_node_count{disk_pressure="false",instance="10.0.0.1:9101",job="pai_serivce_exporter",memory_pressure="false",host_ip="10.0.0.2",out_of_disk="false",pai_service_name="watchdog",ready="true",scraped_from="watchdog-5ddd945975-kwhpr"}
The name label indicates what node this metric represents.
If the node's ready label has the value "unknown", this means the node may disconnect from Kubernetes master, this may due to several reasons:
- Node is down
- Kubelet is down
- Network partition between the node and Kubernetes master
You can first try to log into the node. If you can not, and have no ping response, the node may be down, and you should boot it up.
If you can log in to the node, you should check if the kubelet is up and running, execute sudo systemctl status kubelet command in the node, normally you can see the kubelet service.
After this step, you should check the log of kubelet, to see if it can access Kubernetes API. If you see something like:
E0410 04:24:30.663050 2491 kubelet_node_status.go:386] Error updating node status, will retry: error getting node "10.0.0.1": Get http://10.0.1.2:8080/api/v1/nodes/10.0.0.1: net/http: request canceled while waiting for connection (Client.Timeout exceeded while awaiting headers)
This means the node can not report its status to Kubernetes, and hence the Kubernetes will post unknown status, and this triggered the alert.
You should check what caused this connectivity problem.
NodeFilesystemUsage Alert
This is a kind of alert from the alert manager and is used to monitor the disk space of each server. If usage of disk space is greater than 80%, this alert will be triggered. OpenPAI has two services that may use a lot of disk space. They are storage manager and docker image cache. If there is another usage of OpenPAI servers, they should be checked to avoid the disk usage is caused outside of OpenPAI.
Solutions:
- Check the user file on the NFS storage server launched by the storage manager. If you didn't set up a storage manager, ignore this step.
- Check the docker cache. The docker may use too much disk space for caching, it's worth having a check.
- Check PAI log folder size. The path is
/var/log/pai.
NodeGpuCountChanged Alert
This is an alert from the alert manager and is used to monitor the GPU count of each node.
This alert will be triggered when the GPU count detected is different from the GPU count specified in layout.yaml.
If you find that the real GPU count is correct but the alerts still keep being fired, it's possibly caused by the wrong specification in layout.yaml.
Solutions:
- Enter your dev box container, check the GPU count specified in
<config-dir>/layout.yaml, modify the GPU count accordingly; - Push the modified layout and restart related service:
/pai/paictl.py service stop -n cluster-configuration job-exporter
/pai/paictl.py config push -p <config-dir> -m service
/pai/paictl.py service start -n cluster-configuration job-exporter
NVIDIA GPU is Not Detected
If you cannot use GPU in your job, please check the following items on the corresponding worker node:
- The NVIDIA drivers should be installed correctly. Use
nvidia-smito confirm. - nvidia-container-runtime is installed, and configured as the default runtime of docker. Use
docker info -f "{{json .DefaultRuntime}}"to confirm.
If the GPU number shown in webportal is wrong, check the hivedscheduler and VC configuration.
NvidiaSmiDoubleEccError
This is a kind of alert from the alert manager. It means that NVIDIA cards from the related nodes have double ecc errors. When this alert occurs, the nodes related will be automatically cordoned by the alert manager. After the problem is resolved, you can uncordon the node manually with the following command:
kubectl uncordon <node name>
NodeGpuLowPerfState
This is a kind of alert from the alert manager. It means the NVIDIA cards from related node downgrade into low performance state unexpectedly. To fix this, please run following commands:
sudo nvidia-smi -pm ENABLED -i <gpu-card-id>
sudo nvidia-smi -ac <gpu-supported-memory-clock>,<gpu-supported-clock> -i <gpu-card-id>
You can get the supported clock by sudo nvidia-smi -q -d SUPPORTED_CLOCKS
nvml error: driver/library version mismatch
If jobs fail with the following error:
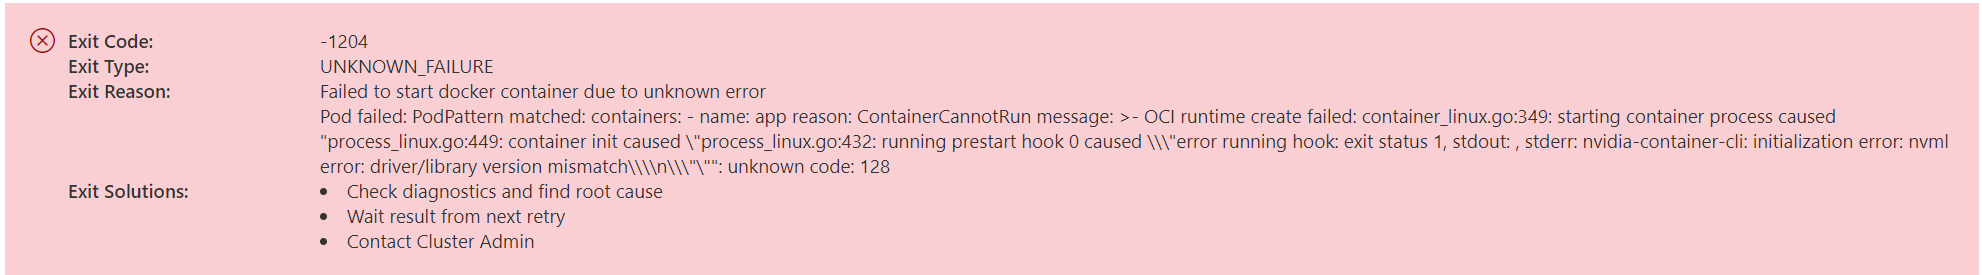
This is caused by the NVIDIA driver/library version mismatch error on the worker node. The driver version may be automatically upgraded.
If you ssh into the worker node & run nvidia-smi, you will see the error Failed to initialize NVML: Driver/library version mismatch.
To resolve this issue, you can simply reboot the worker node. Wait until the worker node becomes free if you don't want to affect the running jobs.
Refer to this thread for more information about this issue.
Cannot See Utilization Information.
If you cannot see utilization information (e.g. GPU, CPU, and network usage) in the cluster, please check if the service prometheus, grafana, job-exporter, and node-exporter are working.
To be detailed, you can exec into a dev box container, then check the service status by kubectl get pod. You can see the pod log by kubectl logs <pod-name>. After you fix the problem, you can restart the whole cluster using paictl.
Node is De-allocated and doesn't Appear in Kubernetes System when it Comes Back
Working nodes can be de-allocated if you are using cloud service and set up PAI on low-priority machines. Usually, if the node is lost temporarily, you can wait until the node comes back. It doesn't need any special care.
However, some cloud service providers not only de-allocate nodes but also remove all disk contents on certain nodes. Thus the node cannot connect to Kubernetes automatically when it comes back. If it is your case, we recommend you set up a crontab job on the dev box node to bring back these nodes periodically.
In How to Add and Remove Nodes, we have described how to add a node. The crontab job doesn't need to do all of these things. It only needs to add the node to the Kubernetes. It figures out which nodes have come back but are still considered NotReady in Kubernetes, then, run the following command to bring it back:
ansible-playbook -i inventory/mycluster/hosts.yml upgrade-cluster.yml --become --become-user=root --limit=${limit_list} -e "@inventory/mycluster/openpai.yml"
${limit_list} stands for the names of these de-allocated nodes. For example, if the crontab job finds node a and node b are available now, but they are still in NotReady status in Kubernetes, then it can set limit_list=a,b.
How to Enlarge Internal Storage Size
Currently, OpenPAI uses internal storage to hold database. Internal storage is limited size storage. It leverages loop devices in Linux to provide a storage with strictly limited quota. The default quota is 30 GB (or 10GB for OpenPAI <= v1.1.0), which can hold about 1,000,000 jobs. If you want a larger space to hold more jobs, please follow these steps to enlarge the internal storage:
Step 1. Exec into a dev box container.
Step 2. In the dev box container, stop all PAI services by ./paictl.py service stop.
Step 3. Log in to the master node. Find the internal storage folder (Default path is /mnt/paiInternal). Move it to another place like: sudo mv /mnt/paiInternal /mnt/paiInternalBak
Step 4. Update the internal storage config in the services-configuration.yaml. For example, set the quota to 100 GB:
internal-storage:
    quota-gb: 100
If there is no internal-storage section in the file, you can add it manually.
Update it by ./paictl.py config push -p <config-folder> -m service
Step 5. In the dev box container, start the internal storage service by ./paictl.py service start -n internal-storage
Step 6. After the internal storage service is ready, there will be a new /mnt/paiInternal in the master node. Move the previous data to it. Currently, we only need to move the pgdata folder: sudo mv /mnt/paiInternalBak/pgdata /mnt/paiInternal/.
Step 7. In the dev box container, start all PAI services by ./paictl.py service start.
Solve Unmounted Database Problem
Before v1.6.0, we use internal storage to mount a file called storage.ext4 to /mnt/paiInternal/storage on the master node. Then database uses /mnt/paiInternal/storage/pgdata as its data root. Sometimes, the path could be unmounted. If database starts before internal-storage, it will use unmounted host path. This will cause two pieces of database data.
If some completed jobs are lost, please first identify the problem, then solve it by following the steps below. We also recommend you to check this before you upgrade to v1.6.0.
How to identify this issue
First, stop all PAI services. On master node, run sudo umount /mnt/paiInternal/storage. After unmounting, if folder /mnt/paiInternal/storage/pgdata exists, the problem can be identified. If /mnt/paiInternal/storage/pgdata doesn't exist, you can igore this issue safely.
How to solve the problem
If the problem happens, there will be two pieces of database data. Please first backup them.
The backup process:
- Stop all PAI services. On master node, run
sudo umount /mnt/paiInternal/storage. Please backup/mnt/paiInternal/storage/pgdata. - In dev box container, run
./paictl.py service start -n cluster-configuration internal-storage. Then go to master node, backup/mnt/paiInternal/storage/pgdatato a different places.
We will merge the two database data, and then upgrade to v1.6.0 or later version to resolve this issue. Please first install postgresql client 12 on master node. Then follow the steps below.
- In dev box container, stop all PAI services by
./paictl.py service stop - On master node, run
sudo umount /mnt/paiInternal/storage. - In dev box container, run
./paictl.py service start -n cluster-configuration postgresql. Please notice the source code used in dev box container should be underv1.6.0in this step. - On master node, connect to the database by
psql -U root -h 127.0.0.1 -W openpai. The default password isrootpass. Then create a table with nameframeworks_tmpbyCREATE TABLE frameworks_tmp AS TABLE frameworks WITH NO DATA;. And insert frameworks data into it:INSERT INTO frameworks_tmp SELECT * FROM frameworks;. Use\qto exit from the database terminal. - Dump the database by
pg_dump -U root -h 127.0.0.1 -W -t framework_events -t framework_history -t pod_events -t pods -t task_history -t tags -f exclude_frameworks_dump.sql -a openpaiandpg_dump -U root -h 127.0.0.1 -W -t frameworks_tmp -f frameworks_tmp_dump.sql openpai. - In dev box container, run
./paictl.py service stop -n cluster-configuration postgresql. Wait serveral minutes, run./paictl.py service start -n cluster-configuration internal-storage postgresql - On master node, restore the data to
framework_tmp:psql -U root -h 127.0.0.1 -W -f frameworks_tmp_dump.sql openpai - Connect to the database
psql -U root -h 127.0.0.1 -W openpai. Then merge the tables by:DELETE FROM frameworks WHERE name in ( SELECT name FROM frameworks_tmp );andINSERT INTO frameworks SELECT * FROM frameworks_tmp;. - On the master node, restore the remaining data:
psql -U root -h 127.0.0.1 -W -f exclude_frameworks_dump.sql openpai - In dev box container, stop all PAI services.
- Follow upgrade-guide to upgrade the cluster to
v1.6.0or later version.